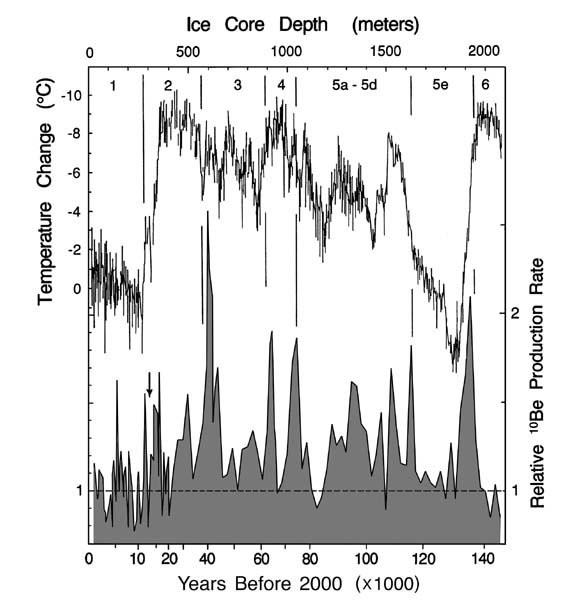
Lower graph: Relative beryllium-10 production rate in the Earth’s atmosphere as an
indicator of cosmic ray intensity variations on the Earth s surface during the past 145,000 years.
Based on the Vostok ice core data of Raisbeck, et al. (1987) adjusted for variations in ice accumulation rate. Upper graph: global temperature based on Vostok ice core deuterium isotope
data. The numbered climatic zones include: the present interglacial (1), the last ice age (2, 3, &
4), a semiglaciated interval (5a-d), the last interglacial (5e), and the previous glaciation (6).